
As the nutrient credit market has grown, so too has the variation in the quality of the assessments that underpin it. For developers, planning consultants and local planning authorities navigating the nutrient neutrality system, that variation matters far more than it might appear. The difference between a scheme built on rigorous hydrological analysis and one that relies on generalised mapping is not a technical footnote — it is the difference between mitigation that holds up and mitigation that does not, writes Zak Simmonds, Technical Director at the National Rivers Consortium.
I have been working in nutrient neutrality since 2021 and have been involved in well over 500 nutrient assessments. In that time, one thing has become consistently clear: the credibility of a nutrient credit scheme rests entirely on the quality of the technical work that underpins it. A fundamental part of this is ensuring that mitigation is hydraulically relevant to the development.
A catchment boundary determines the geographic area from which water drains to a specific river, estuary or protected habitat. In nutrient neutrality terms, it establishes whether a development site sits within a nutrient-sensitive catchment at all, and if so, to what degree it requires mitigation. Get it right, and the assessment reflects reality. Get it wrong, and the consequences ripple outwards — through the planning process, through the LPA’s decision-making, and critically through the amount of mitigation required.
Why boundary errors carry real consequences
The consequences of not having clearly defined boundaries are significant uncertainty about whether mitigation is upstream of a development’s point of impact within the protection site. This results in a loss of credibility and uncertainty about the validity of generated nutrient credits.
Before moving into nutrient neutrality, I spent almost ten years working as a Civil Engineer on drainage strategy and detailed design for some highly complex sites, former gas works, quarries, and heavily contaminated land. That experience gave me a deep understanding of how water actually moves through a landscape, and how poorly that behaviour is captured by simple, generalised mapping. It is critical to use refined datasets cross-referenced against protected site locations and wastewater treatment work discharge points to gain a substantive picture of individual catchment applicability.
This is why the tools we use to define catchment boundaries matter. And it is why NRC invests in state-of-the-art GIS technology that less technically equipped operators are not currently using.
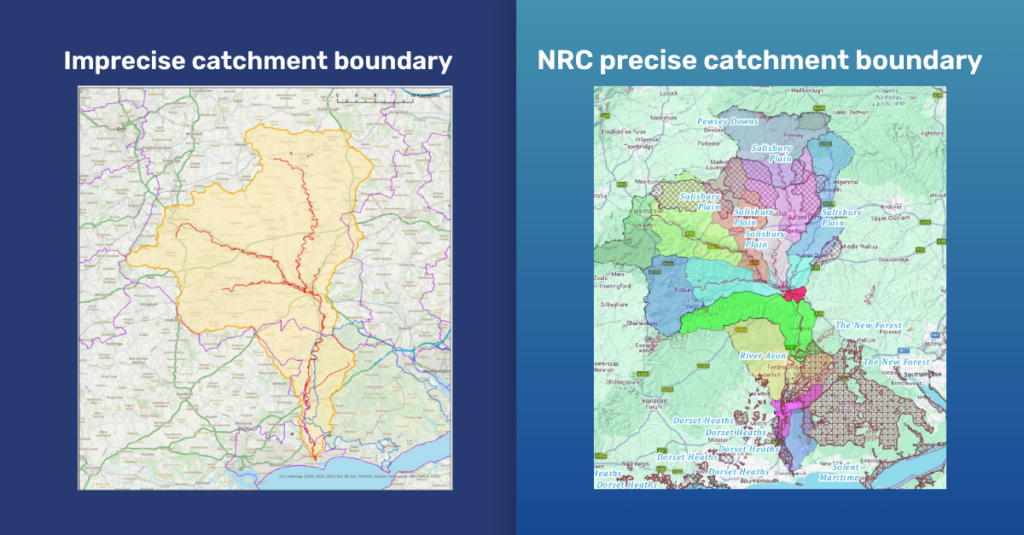
The tools behind NRC’s hydrological assessments
At NRC, our catchment delineation work is built on two specialist GIS platforms: QGIS and Scalgo.
QGIS is a powerful open-source geographic information system used primarily for drafting our catchment boundary outputs. It allows our engineers to work simultaneously with detailed topographic data, land-use layers and drainage network datasets, providing the spatial foundation for understanding how water moves across a given landscape and how individual sub-catchments connect to the wider hydrological network.
Scalgo is used to process the terrain datasets that underpin our flow path analysis, adding depth to NRC’s hydrological modelling capability and distinguishing our assessments from those produced by operators relying on desktop approximations. It processes high-resolution terrain data to trace precise flow paths across a site — including through complex, low-gradient landscapes where the path of water is far from obvious. The combination of these two platforms allows our team to define catchment boundaries with a level of confidence and technical defensibility that is difficult to match through simpler methods.
One of the core arguments I have made since joining this sector is that nutrient assessments are, fundamentally, an engineering problem. Understanding surface water and foul water drainage systems, interpreting hydrological modelling outputs, and grasping how drainage strategy decisions affect a site’s nutrient load — these are skills that come from a background in civil and environmental engineering. It is why NRC’s technical team is built around engineers rather than generalists, and why I believe that distinction matters when the quality of the output is being scrutinised by an LPA or Natural England.
From GIS analysis to a Technical Mitigation Report that stands up to scrutiny
The output of our hydrological assessment feeds directly into the Technical Mitigation Reports that accompany every nutrient credit transaction with NRC, of which we have now completed over 550. The TMR is the document that regulators will examine. It must clearly demonstrate — and withstand challenge — that the credits being relied upon are genuinely drawn from the correct catchment and that the nutrient reduction they represent is real, measurable and durable.
Because NRC’s catchment delineation is grounded in regional GIS modelling rather than pre-defined polygons or desk-based assumptions, our Technical Mitigation Reports are built on a technically defensible foundation. In practice, that translates into fewer queries from regulators, faster determinations and greater confidence for developers and their consultants throughout the consenting process.
This is not a minor operational detail. For developers, certainty about the quality of their mitigation is as important as certainty about its availability. A scheme that proceeds based on a poorly evidenced TMR carries risk that may not become visible until it is most difficult to address.
What to look for when selecting a credit supplier
Not all nutrient credit schemes are built to the same standard. The market has grown quickly, and the technical rigour of the assessments that underpin credit generation varies considerably between suppliers. Some operators conduct detailed, specific assessments backed by hydrological analysis. Others rely on simplified catchment mapping that has not been tested against real terrain data.
For planning consultants advising clients on nutrient mitigation, and for Local Planning Authorities assessing whether a proposed scheme meets the bar set by Natural England, it is worth asking direct questions:
- What tools has the supplier used for catchment delineation?
- Is the team conducting assessments technically qualified to do so?
- And has the approach been accepted by the relevant planning authority?
These are not unreasonable questions. They are the questions that separate mitigation built on solid foundations from mitigation that carries risk.
Delivering certainty through technical excellence
At the National Rivers Consortium, we work alongside RSK Biocensus to deliver Nutrient Neutrality solutions across England. The technical approach we take to catchment mapping is not incidental to that mission — it is central to it.
The nutrient neutrality system only works if the mitigation within it is credible. That credibility begins with the accuracy of the hydrological assessment. It is built through the quality of the engineering behind it, secured through robust legal frameworks, and ultimately demonstrated through outcomes that regulators, planning authorities and developers can rely on.
That is what we are delivering. And we believe it is the standard the entire sector should be working towards.